Database Administration Portfolio Project

MySQL DBA
End-to-End Project

An end-to-end MySQL database administration project I built on publicly available environmental and public health datasets. I designed a star schema across 14 tables, loaded 22.7 million rows of cancer, air quality, water quality, food environment, and agricultural data, diagnosed and resolved critical performance problems, implemented a full backup and recovery strategy, and secured the database with role-based access control.

MySQL 8.0.45 Schema Design Performance Tuning Backup & Recovery Security & RBAC EPA / CDC / USDA Data

What This Project Demonstrates

The Goal

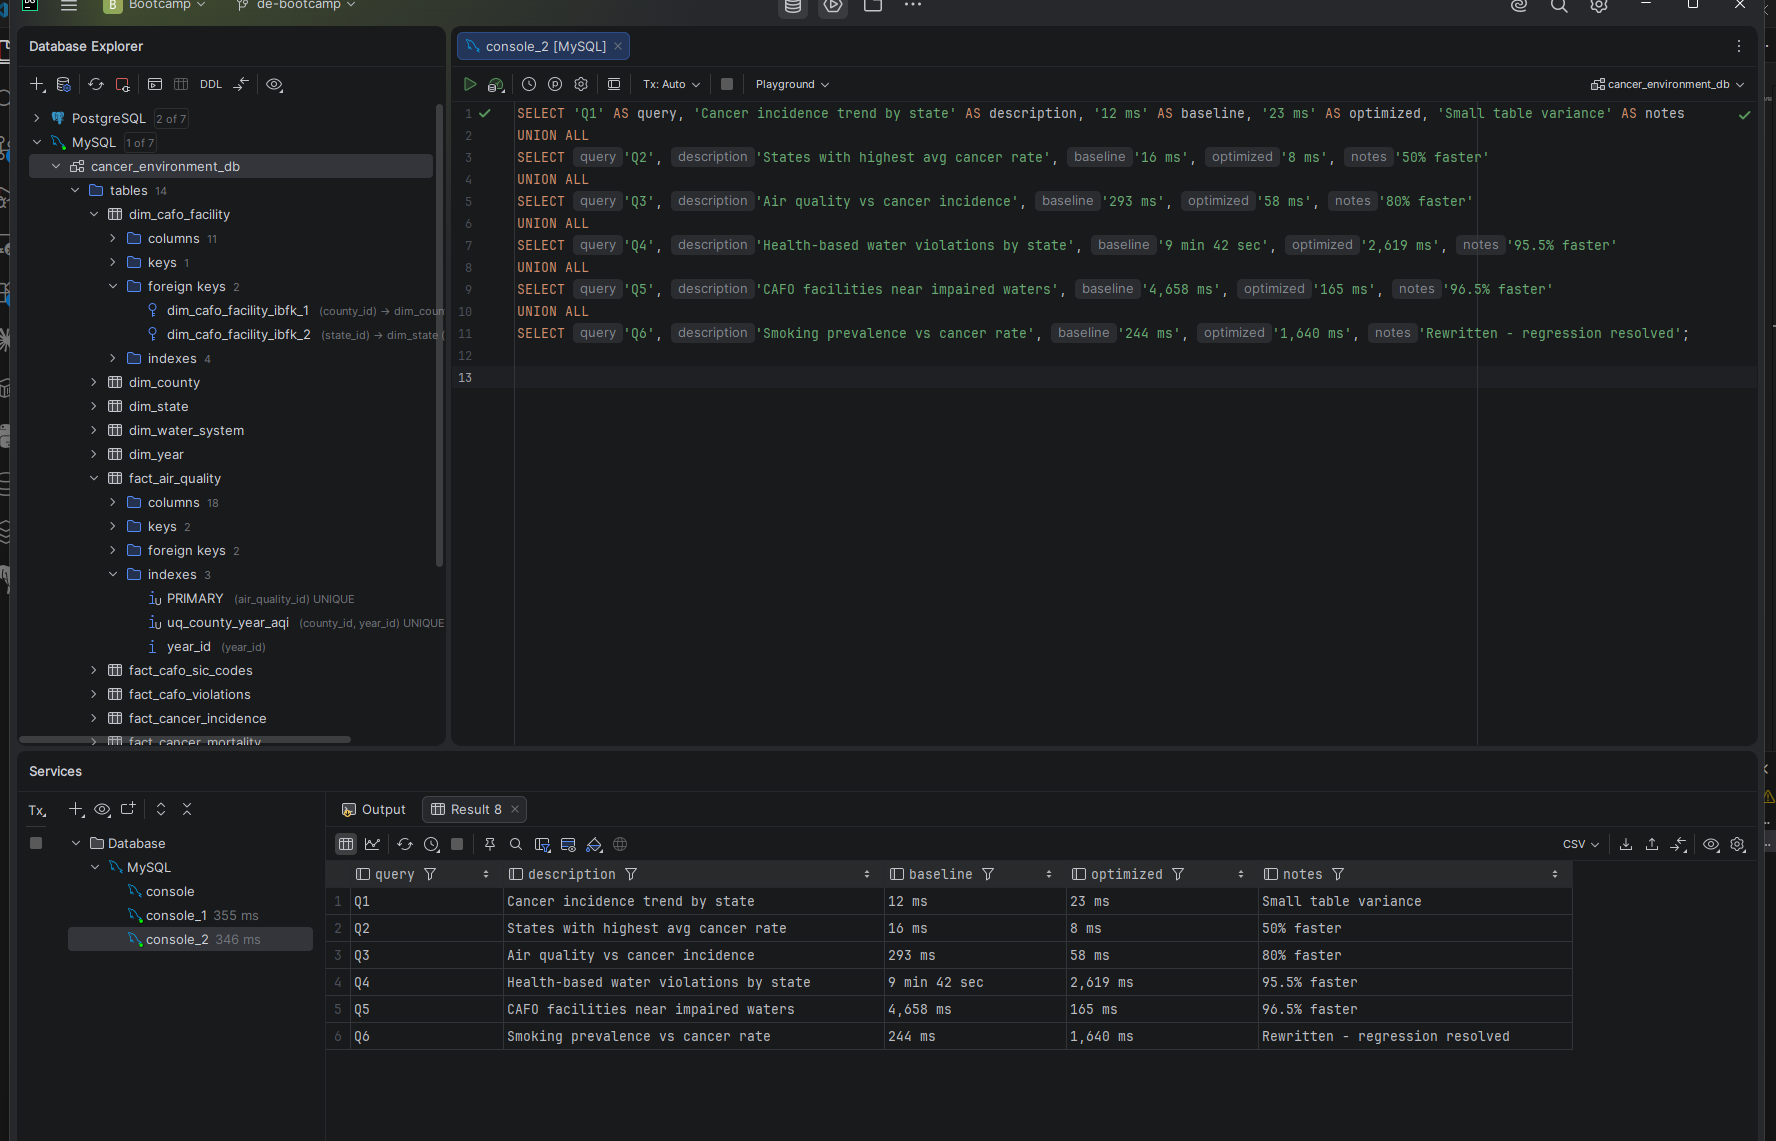
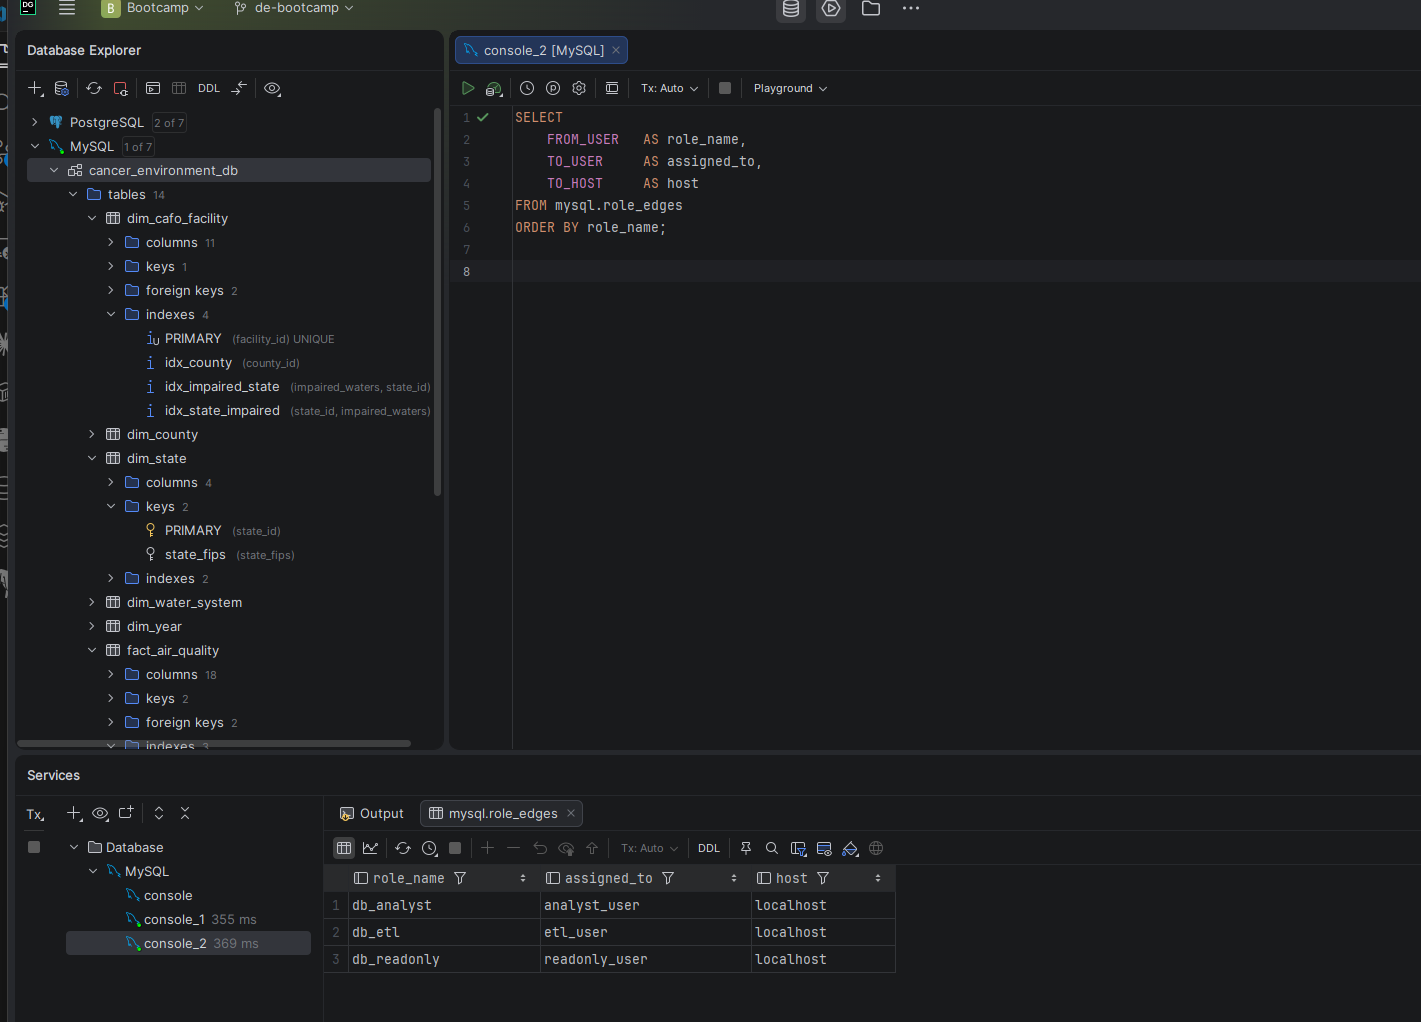
I wanted to build a MySQL project that covers the full scope of database administration — not just queries. Schema design, bulk data loading, performance baselining, index optimization, backup and recovery, and security aren't isolated skills. They form a complete discipline, and this project treats them that way.

The Dataset

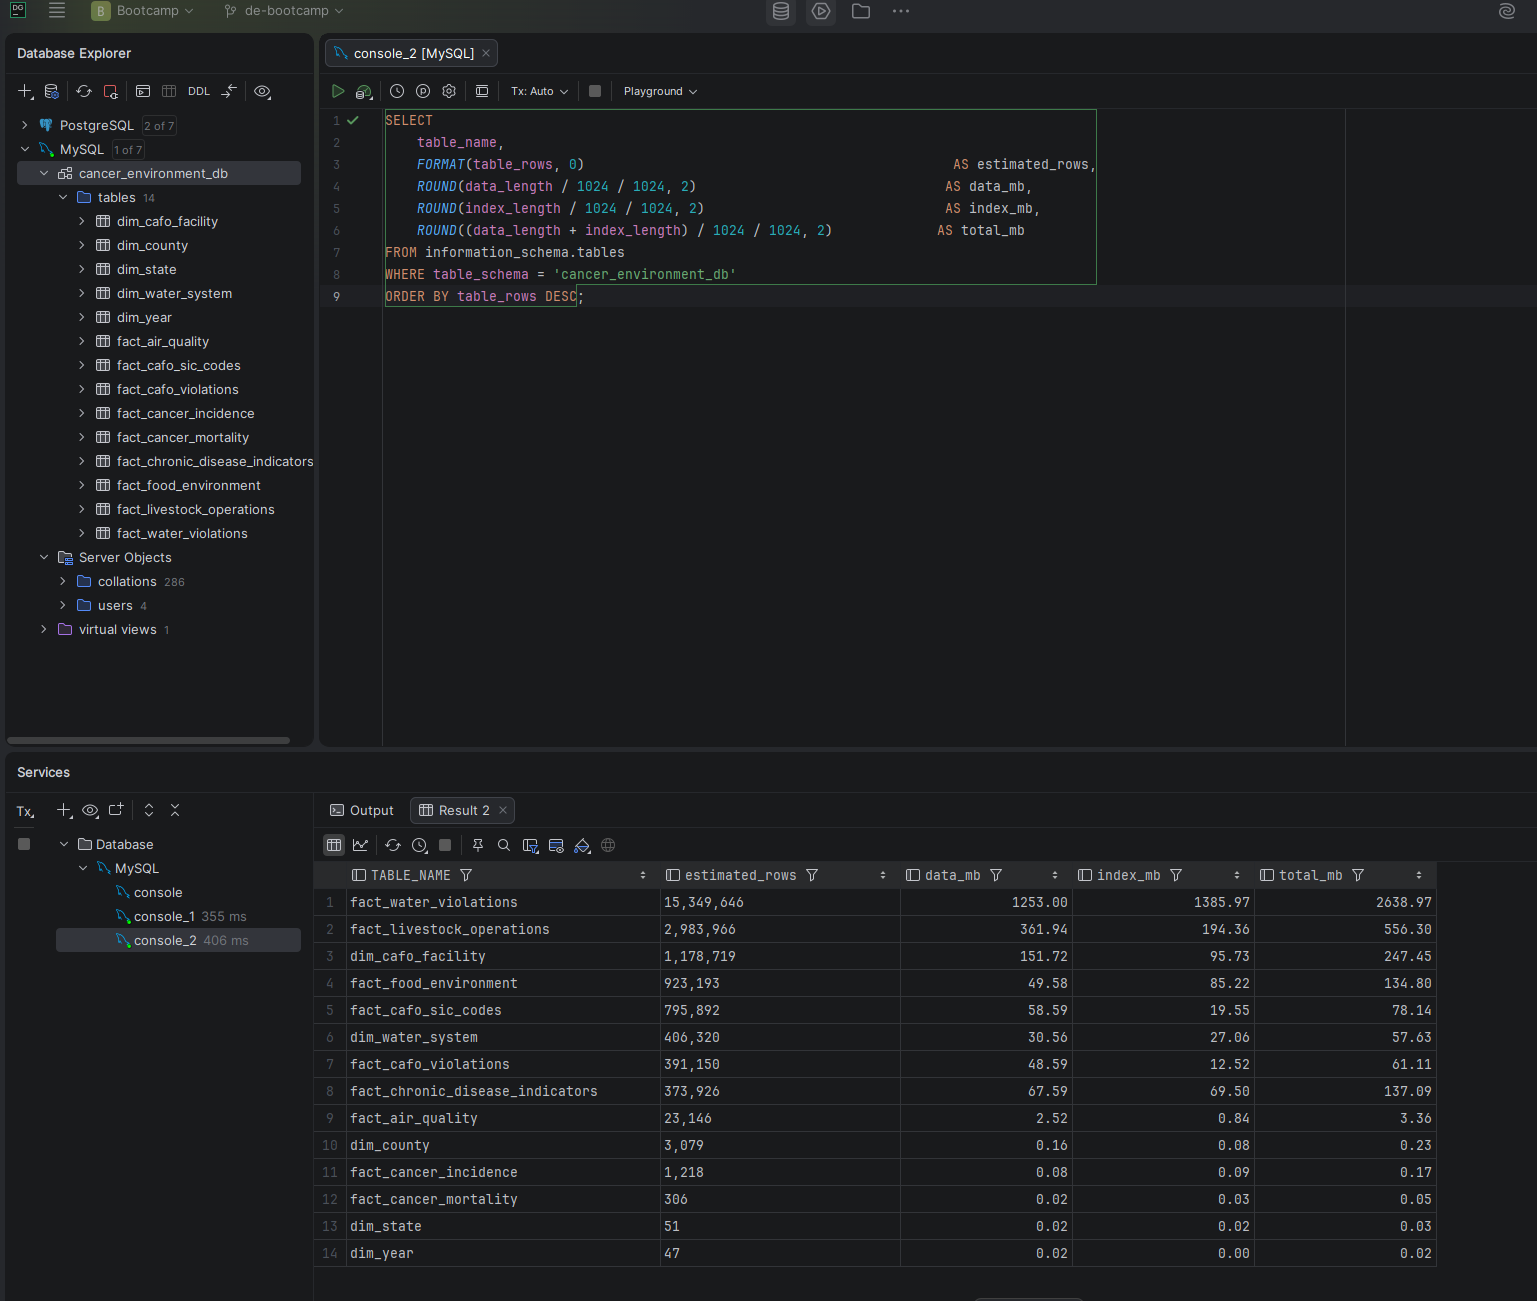
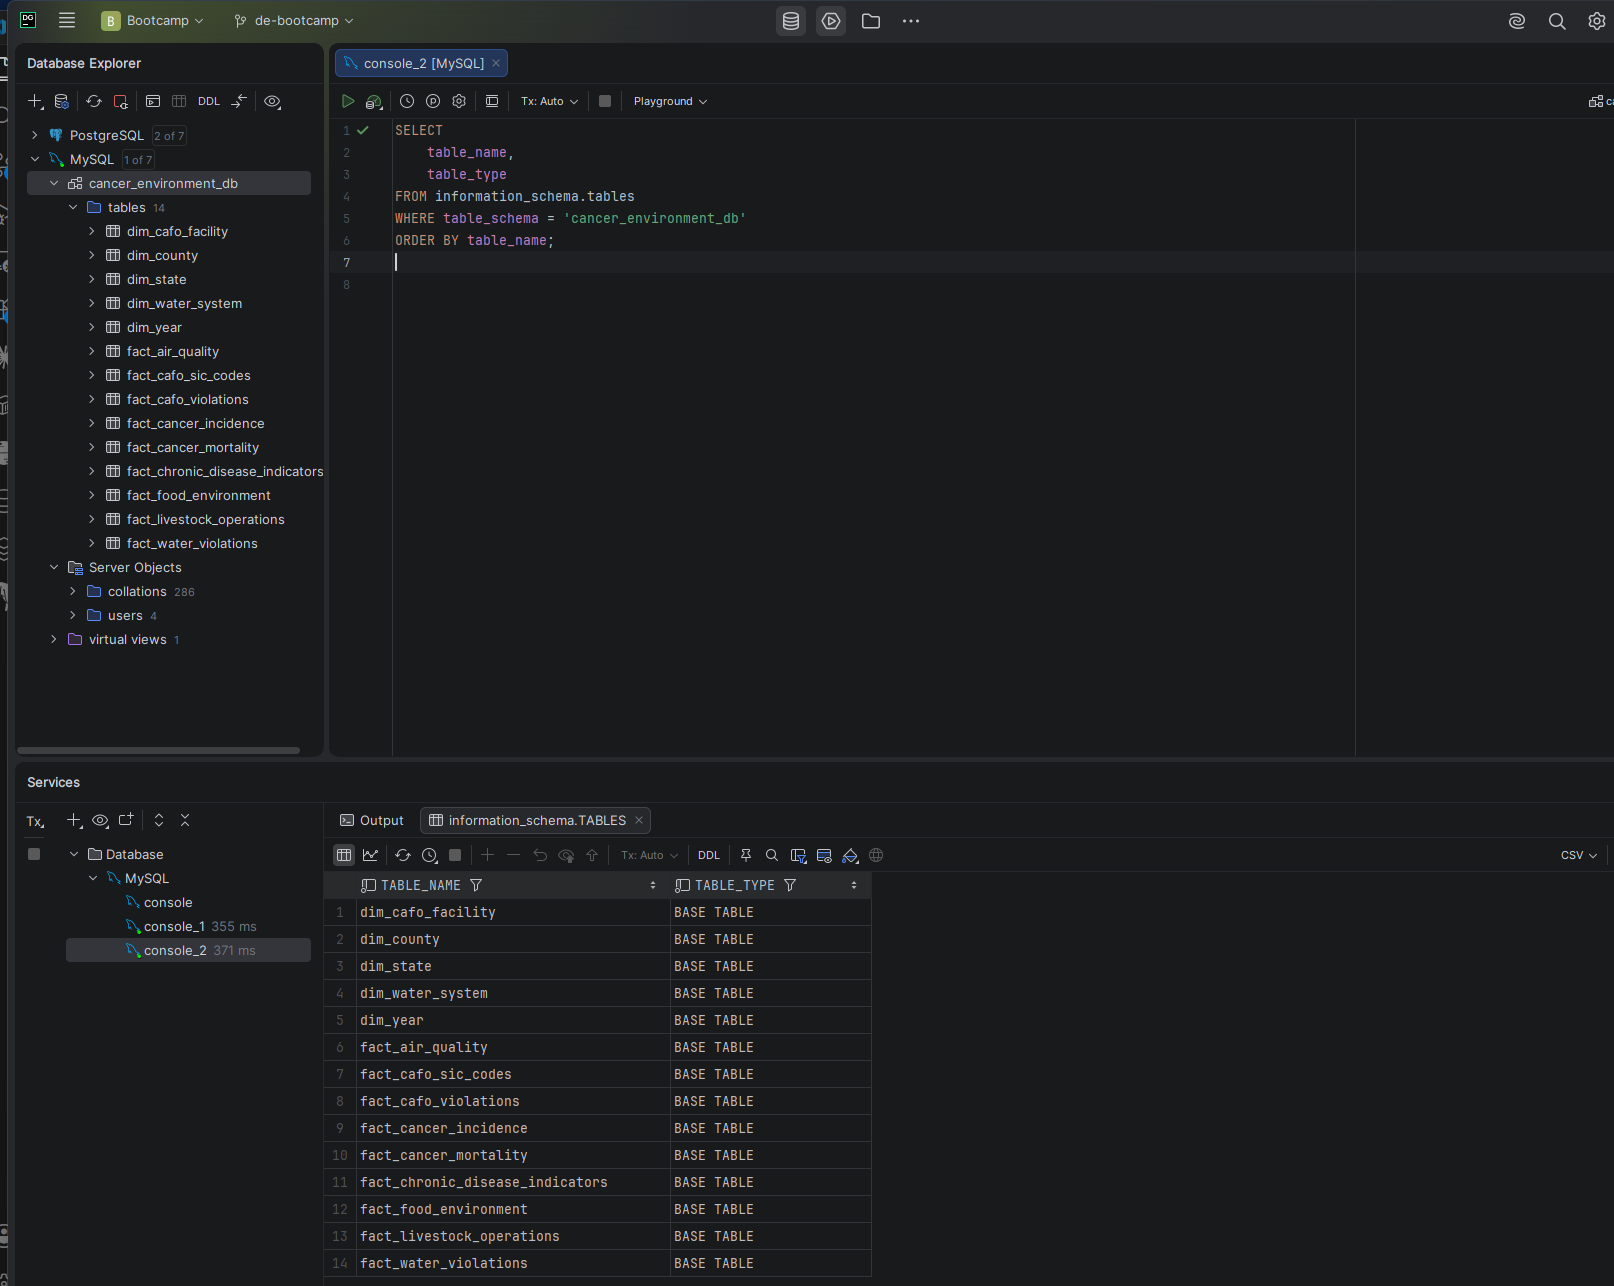
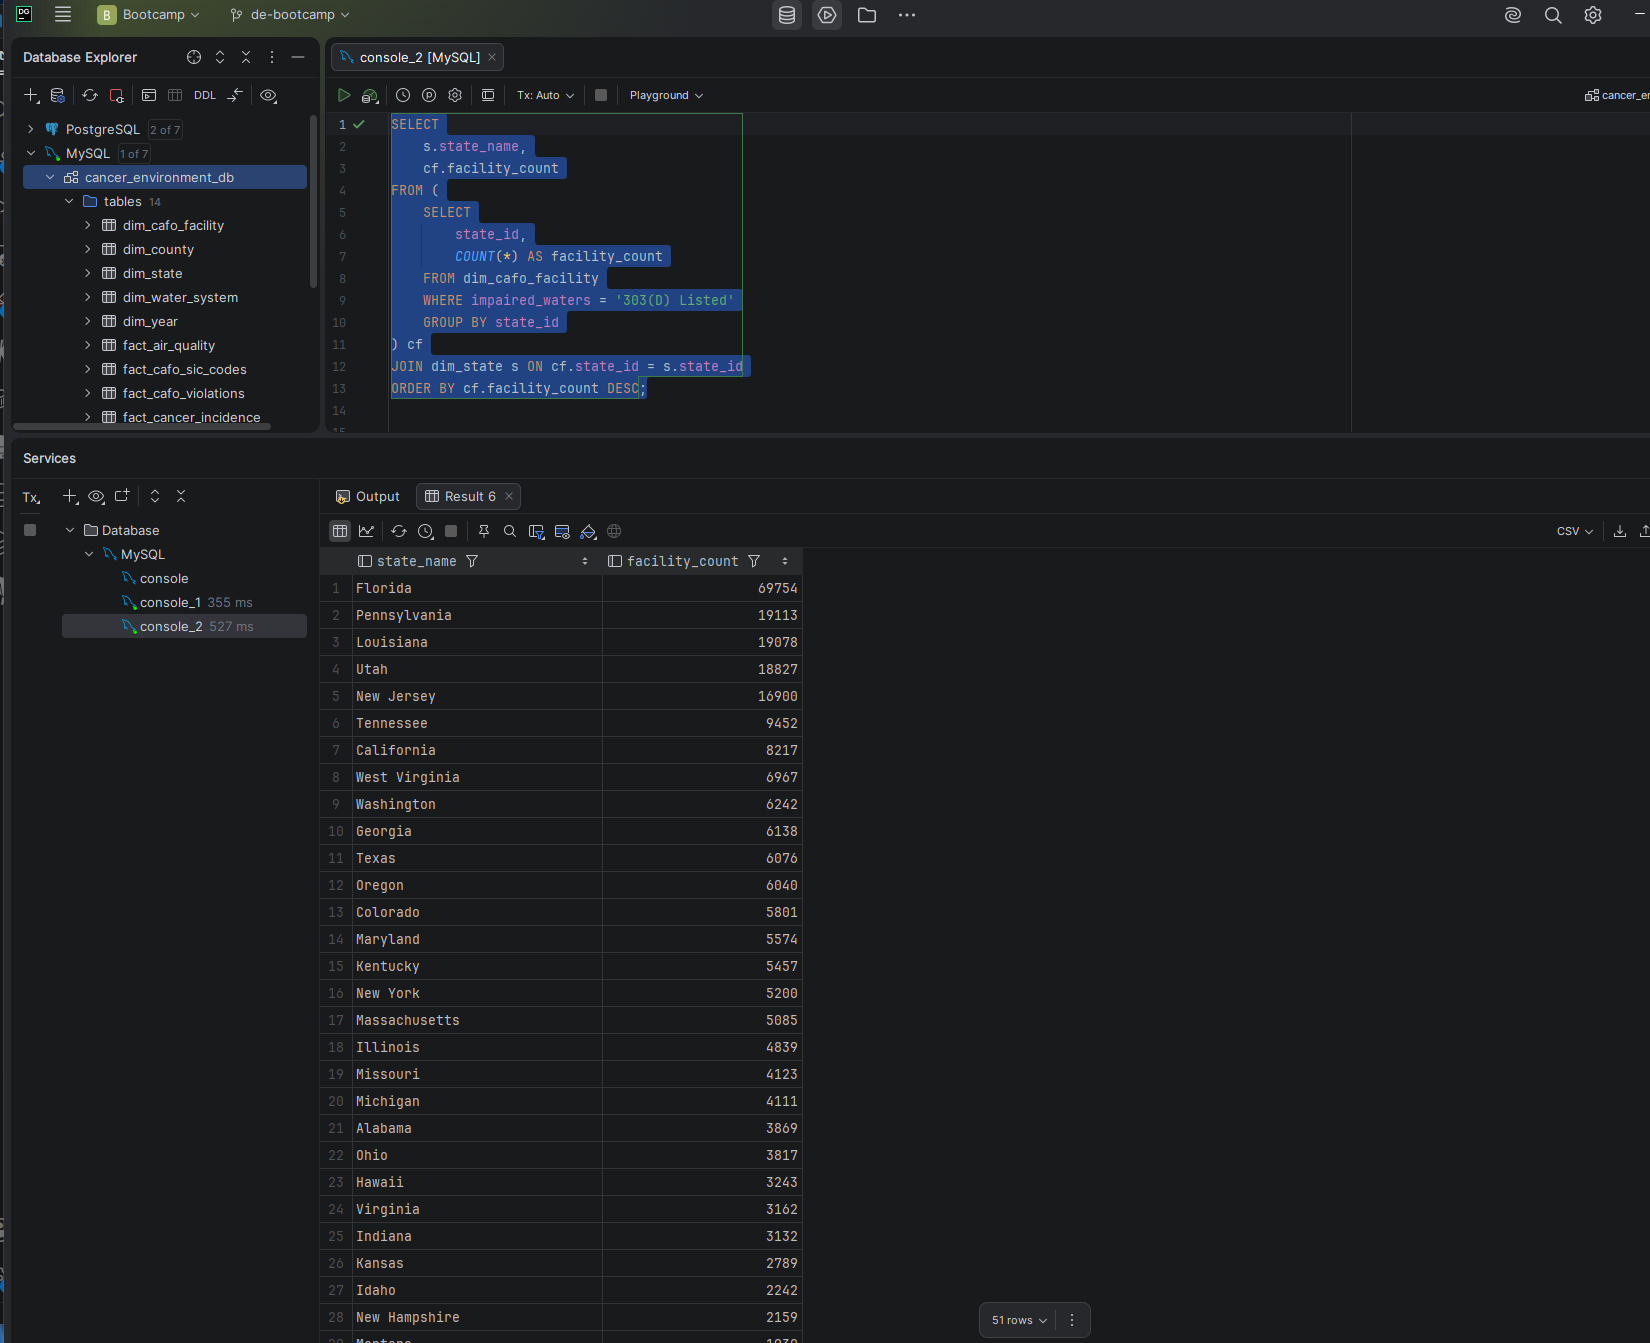
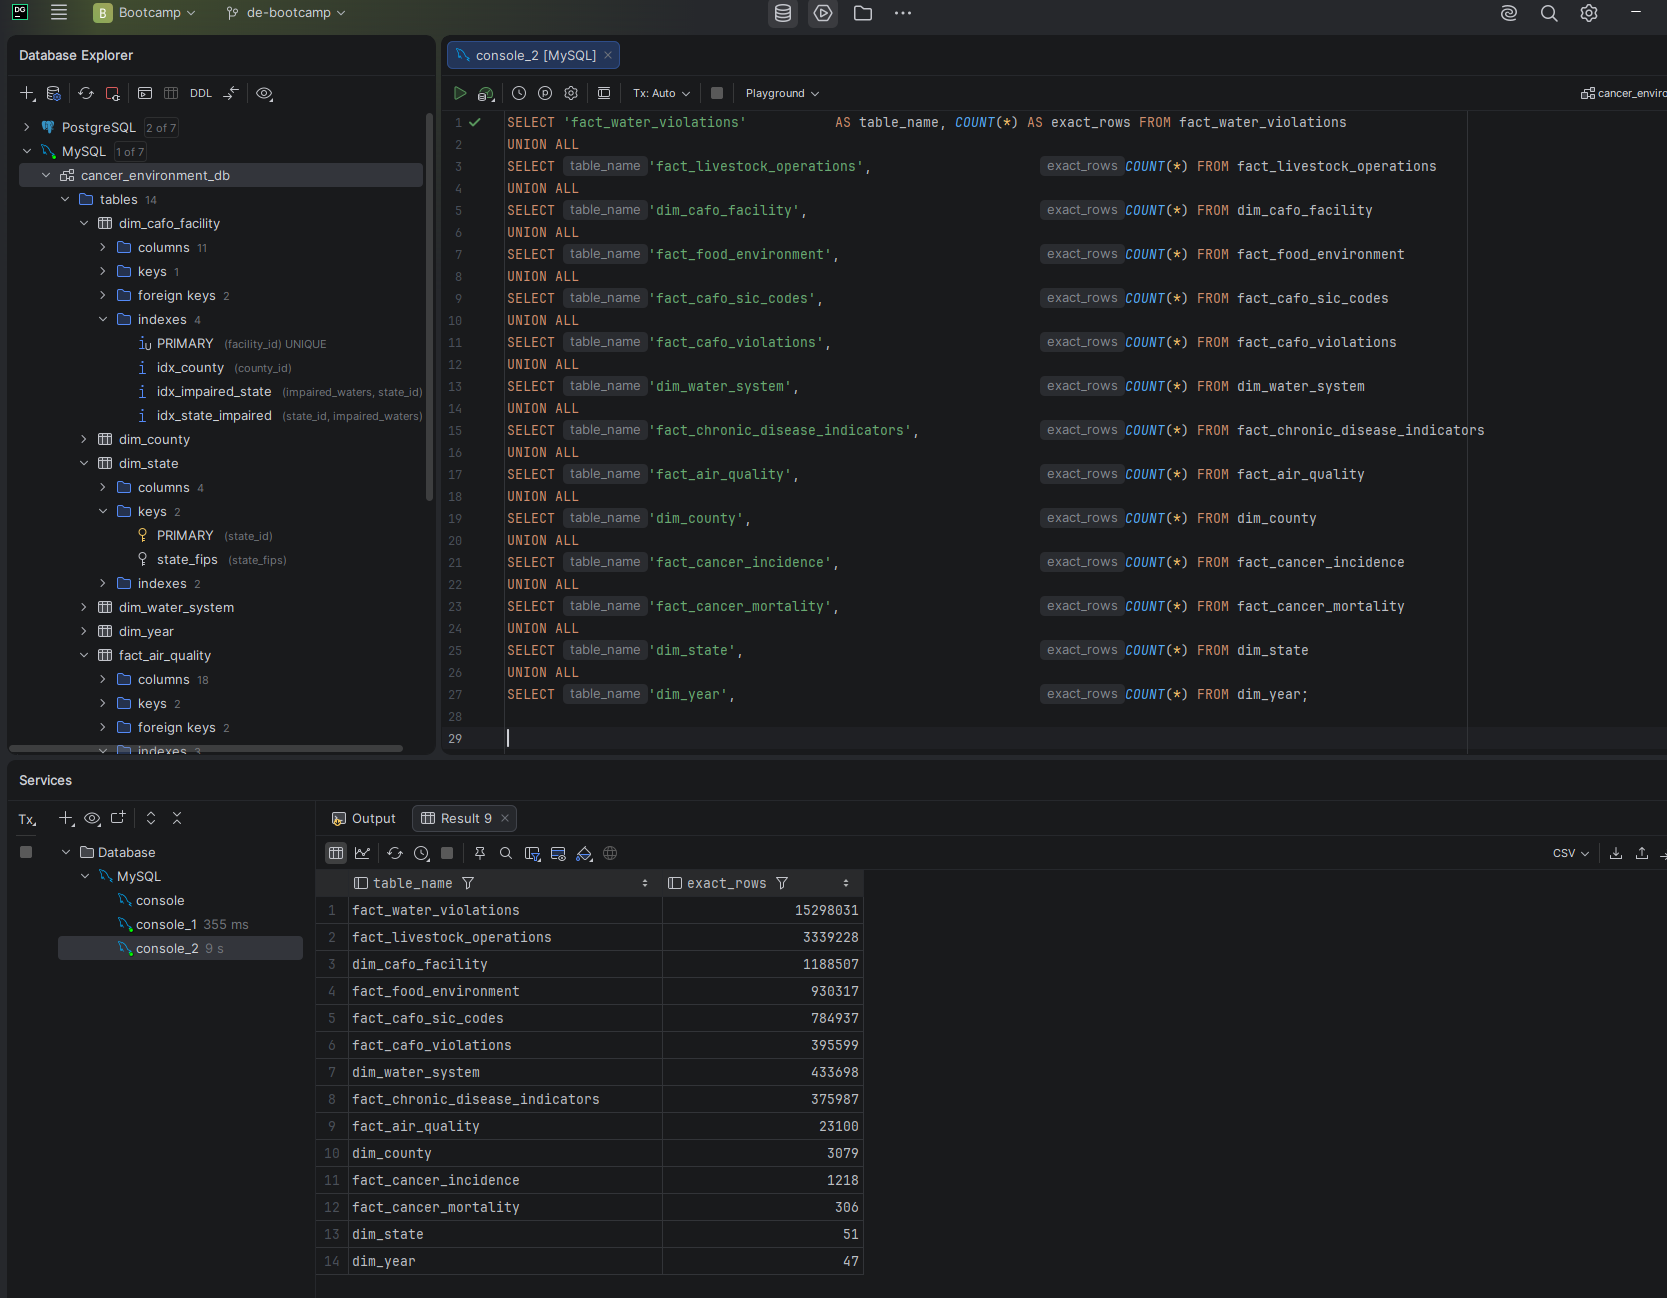
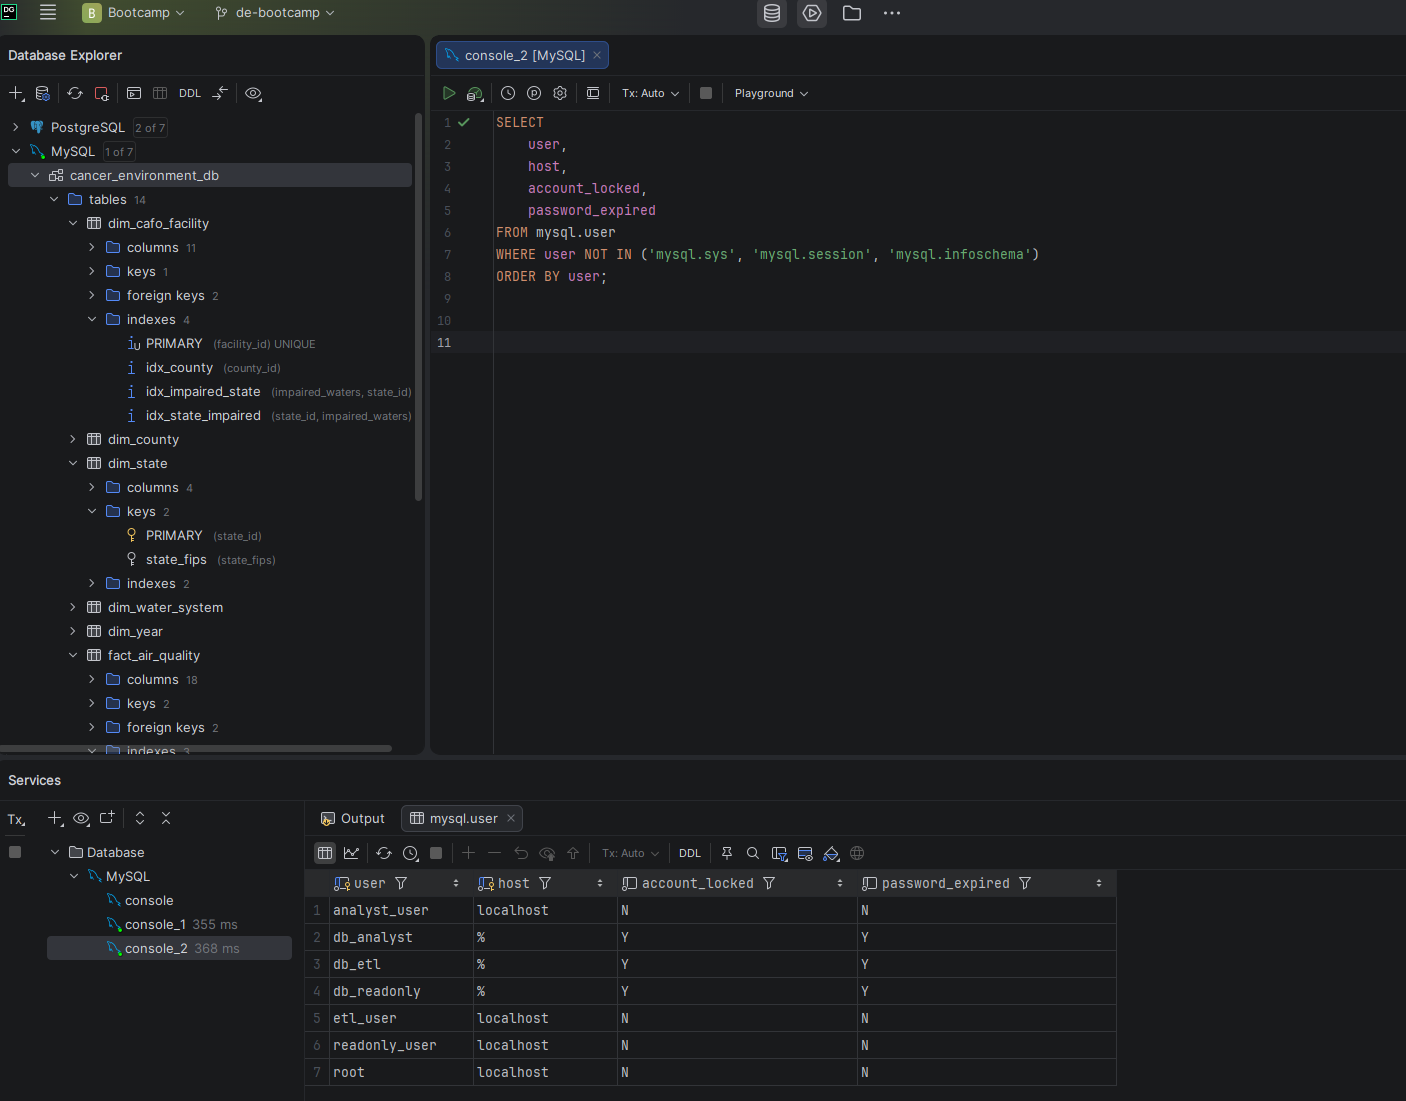
I used eight publicly available datasets from the EPA, CDC, and USDA to explore the relationship between cancer rates across the United States and contributing environmental, lifestyle, food, and water quality factors. The database covers cancer incidence and mortality, air quality, drinking water violations, food environment, chronic disease indicators, agricultural operations, and CAFO facility data — 22.7 million rows across 14 tables in a star schema design.

22.7M
Rows Loaded
14
Tables
4.57 GB
Database Size
95.5%
Query Improvement
6
Project Phases
Screenshot — Database Size Summary
Database size summary showing 22.7M rows across 14 tables totaling 4.57 GB

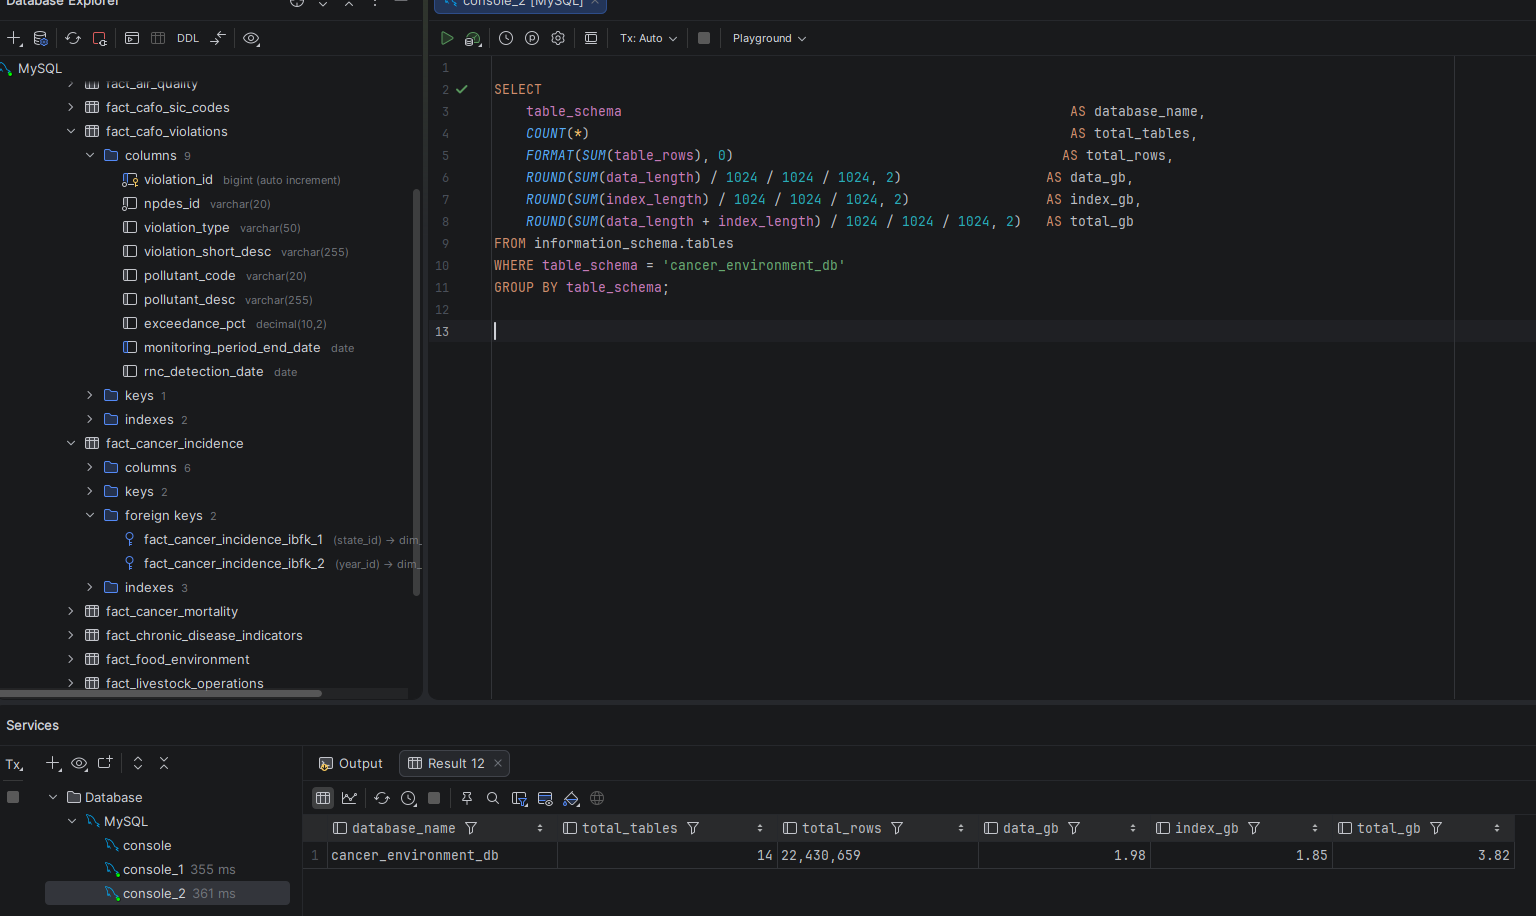
cancer_environment_db — 14 tables, 22.7M rows, 4.57 GB total

Six Phases, One Complete Project

Phase 01 — Data Sourcing
Data Sourcing & Documentation

I identified, verified, and downloaded eight datasets from EPA, CDC, and USDA. I wrote Python download scripts for EPA AQI data across 23 years and SDWIS water quality data, configured .gitignore to exclude raw data files, and documented every source with scientific references.

Phase Complete
Phase 02 — Schema & Loading
Schema Design & Data Loading

I designed a star schema with 4 dimension tables and 10 fact tables, created the database with utf8mb4 charset, and loaded 22.7 million rows across all 14 tables using a combination of SQL LOAD DATA and Python scripts. Every design decision is documented with rationale.

Phase Complete
Phase 03 — Diagnostics
Baseline Measurement & Diagnostics

Before optimizing anything I measured everything — database size, table inventory, and execution times for six representative queries. Q4 took 9 minutes 42 seconds. That is the baseline. EXPLAIN plans identified the root cause for both problem queries before I touched a single index.

Phase Complete
Phase 04 — Optimization
Performance Optimization

I added composite indexes, rewrote queries using CTEs and subquery pre-aggregation, audited and dropped 11 unused indexes, and reviewed MySQL configuration settings. Q4 dropped from 9 minutes 42 seconds to 2,619 ms. Q5 dropped from 4,658 ms to 165 ms.

Phase Complete
Phase 05 — Backup & Recovery
Backup & Recovery

I implemented a mysqldump backup strategy using --single-transaction and --source-data=2 for consistent InnoDB snapshots with binary log position recording. I produced a 2.18 GB full backup, dropped the entire database to simulate data loss, and restored all 22.7 million rows from the backup file.

Phase Complete
Phase 06 — Security
Security & User Management

I designed and implemented role-based access control with three least-privilege roles — db_readonly, db_analyst, and db_etl — and three corresponding users. Every user is scoped to localhost only, and no application user holds global privileges or schema modification rights.

Phase Complete

Star Schema Across 14 Tables

Design Approach

I chose a star schema because the research question — correlating cancer rates with environmental and lifestyle factors — is fundamentally analytical. Dimension tables hold stable reference data (states, counties, years, water systems) while fact tables hold measurements and events. This separation keeps joins clean and query patterns predictable.

The most significant design decision was building dim_county from the USDA Census of Agriculture rather than a generic county list. This means only counties with agricultural activity are included — approximately 1,388 EPA AQI counties and 27,400 food environment records were excluded as a documented known limitation. The tradeoff was worth it: it keeps the county dimension grounded in the agricultural data rather than forcing artificial joins.

Screenshot — Table Inventory
Table inventory showing all 14 tables with row counts and sizes

14 tables — 4 dimension, 10 fact — across the full dataset

Screenshot — Schema Overview in DataGrip
DataGrip database explorer showing all 14 tables in cancer_environment_db

cancer_environment_db in DataGrip — full table inventory visible in the database explorer

Before & After Optimization

I ran six analytical queries before and after adding indexes and rewriting query logic. The results below are measured execution times from DataGrip — real numbers from real runs, not estimates.

Query Description Before After Result
Q1 Cancer incidence trend by state 12 ms 23 ms Small table variance
Q2 States with highest avg cancer rate 16 ms 8 ms 50% faster
Q3 Air quality vs cancer incidence 293 ms 58 ms 80% faster
Q4 Health-based water violations by state 9 min 42 sec 2,619 ms 95.5% faster
Q5 CAFO facilities near impaired waters 4,658 ms 165 ms 96.5% faster
Q6 Smoking prevalence vs cancer rate 244 ms 1,640 ms Rewritten — regression resolved
Screenshot — Q4 Baseline EXPLAIN
EXPLAIN output for Q4 showing full nested loop scan through 15.3M rows

Q4 baseline EXPLAIN — full nested-loop scan through 15.3M violation rows, is_health_based_ind filter applied after the join

Screenshot — Q4 Optimized Result
Q4 optimized query result showing 2,619ms execution time

Q4 after optimization — 9 min 42 sec down to 2,619 ms using CTE pre-filter and composite index

Screenshot — Q5 Optimized Result
Q5 optimized query result showing 165ms execution time

Q5 after optimization — 4,658 ms down to 165 ms using subquery pre-aggregation and corrected composite index

Screenshot — Before / After Comparison
Before and after performance comparison table for all six queries

Full before/after comparison across all six queries after Phase 4 optimization

What the Project Actually Shows

95.5%
A single composite index turned a 9-minute query into a 2.6-second query. Q4 was performing a full nested-loop scan through 15.3 million water violation rows because no index existed on (is_health_based_ind, pwsid). One ALTER TABLE ADD INDEX combined with a CTE rewrite fixed it — the optimizer could now pre-filter health-based violations before joining to any other table.
96.5%
Column order in a composite index is not a detail — it is the whole point. The first Q5 index was built as (state_id, impaired_waters) and the optimizer ignored it entirely, choosing a single-column index instead. Flipping the order to (impaired_waters, state_id) — putting the equality filter column first — dropped Q5 from 3.6 seconds to 165 ms. The wrong column order produced no improvement at all.
11
Dropping 11 unused indexes introduced two regressions — and diagnosing them honestly was part of the work. The index audit correctly identified 11 indexes as unused, but removing them caused Q3 and Q6 to regress significantly. Investigation revealed the root cause was query design, not just missing indexes. Both queries were rewritten using subquery pre-aggregation to eliminate cross joins between fact tables before aggregating.
2.18 GB
A backup that has never been tested is not a backup. I produced a 2.18 GB mysqldump of the 4.57 GB database, dropped the entire database to simulate catastrophic data loss, and restored all 22.7 million rows from the backup file. Every table was verified with exact COUNT(*) queries after restore. The restore procedure is fully documented in the repository.

Backup, Recovery & Access Control

Backup Strategy

I implemented a logical backup strategy using mysqldump with --single-transaction for consistent InnoDB snapshots without table locks, and --source-data=2 to record the binary log position in the dump file for point-in-time recovery capability. Binary logging was confirmed active on the instance before backup execution.

Screenshot — Recovery Verification
Post-recovery row count verification showing all 22.7 million rows restored across 14 tables

Post-recovery verification — all 22,774,105 rows confirmed across all 14 tables after full restore from backup

Role-Based Access Control

I designed a three-tier access model using MySQL 8.0 roles. db_readonly grants SELECT only — for Tableau dashboards and reporting. db_analyst adds CREATE TEMPORARY TABLES for intermediate query results. db_etl grants SELECT, INSERT, UPDATE, and DELETE for data loading pipelines. No role holds CREATE, DROP, ALTER, or any global privilege.

Screenshot — Role Assignments
MySQL role assignments showing db_analyst to analyst_user, db_etl to etl_user, db_readonly to readonly_user

Role assignments confirmed via mysql.role_edges — one role per user, least-privilege throughout

Screenshot — User Inventory
User inventory showing analyst_user, etl_user, and readonly_user with no locked accounts

Three application users — all active, localhost only, no global privileges

Built with MySQL 8.0

MySQL 8.0.45 Core database engine
DataGrip Primary query tool
mysqldump Logical backup
Python 3.13 Data download & loading
EXPLAIN Execution plan analysis
sys schema Index usage audit
MySQL Roles Access control
Git & GitHub Version control
PowerShell CLI & automation
VS Code Script authoring
EPA / CDC / USDA Public data sources
Windows 11 Operating environment

Two Ways In