Overview Phase 1 — Schema & Load Phase 2 — Diagnostics Phase 3 — Optimization Phase 4 — Operations Phase 5 — Security
Phase 03 — Performance Optimization

Fixing What the
Diagnostics Found

Phase 2 told me exactly what was wrong — missing indexes and insufficient memory. In this phase I fixed both, re-ran every baseline query, and measured the results. One missing index produced a 4,136× improvement. Not every query improved dramatically, and I documented that honestly too.

CREATE INDEX CONCURRENTLY work_mem Tuning random_page_cost EXPLAIN ANALYZE 4,136× Improvement

Five Targeted Indexes

Why CONCURRENTLY?

I created all indexes using CREATE INDEX CONCURRENTLY. This is the production-safe approach — it builds the index without holding a lock on the table, meaning reads and writes can continue uninterrupted during the build. On a table with 9.6 million rows, locking during index creation would be unacceptable in a live environment.

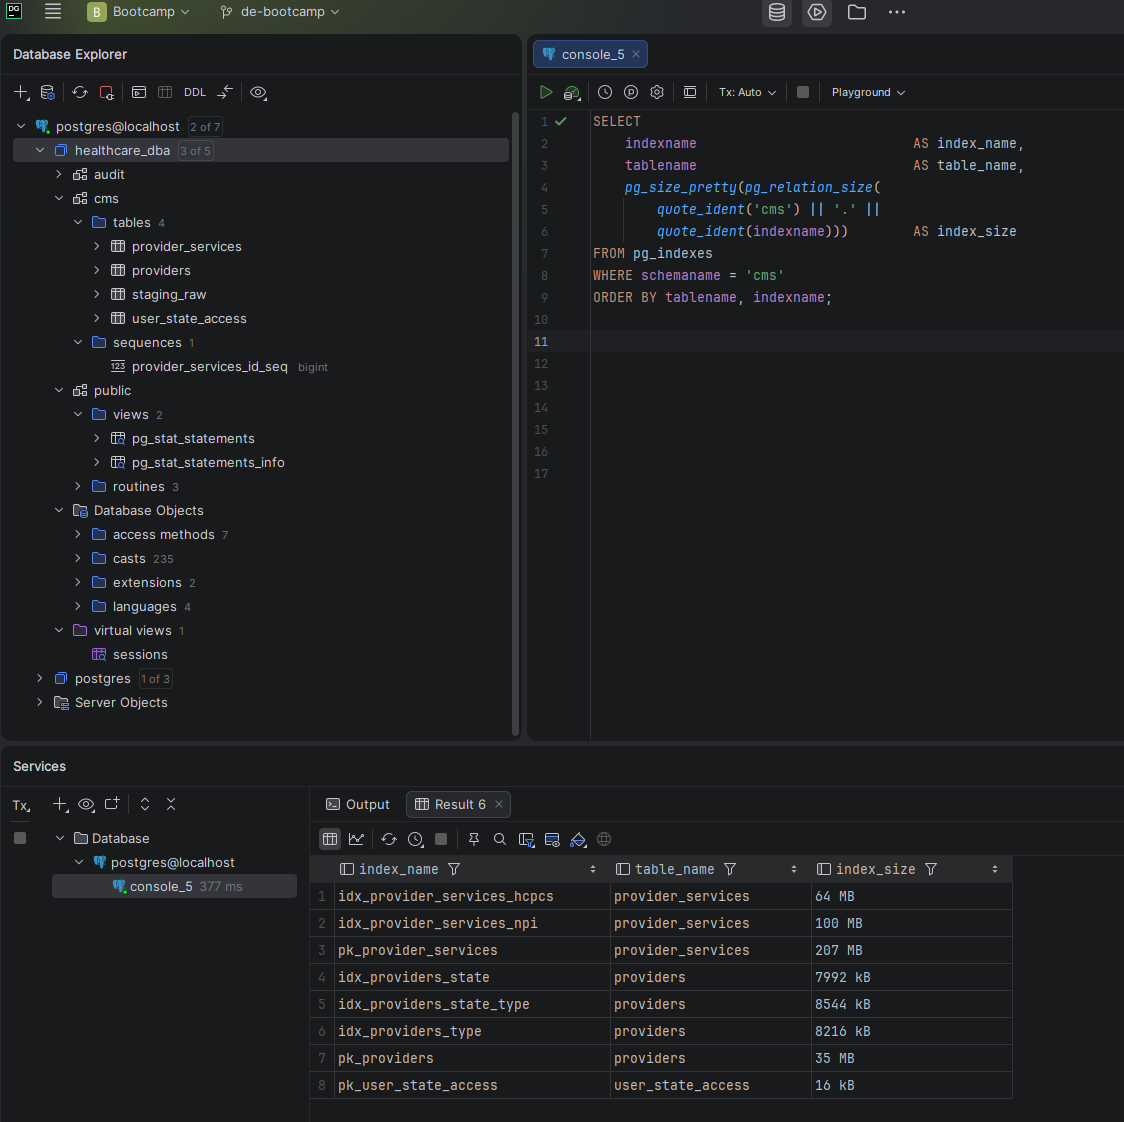
Screenshot — Index inventory after optimization
All seven indexes after optimization including five new analytical indexes
Seven total indexes — two primary keys plus five new analytical indexes targeting the columns identified in Phase 2
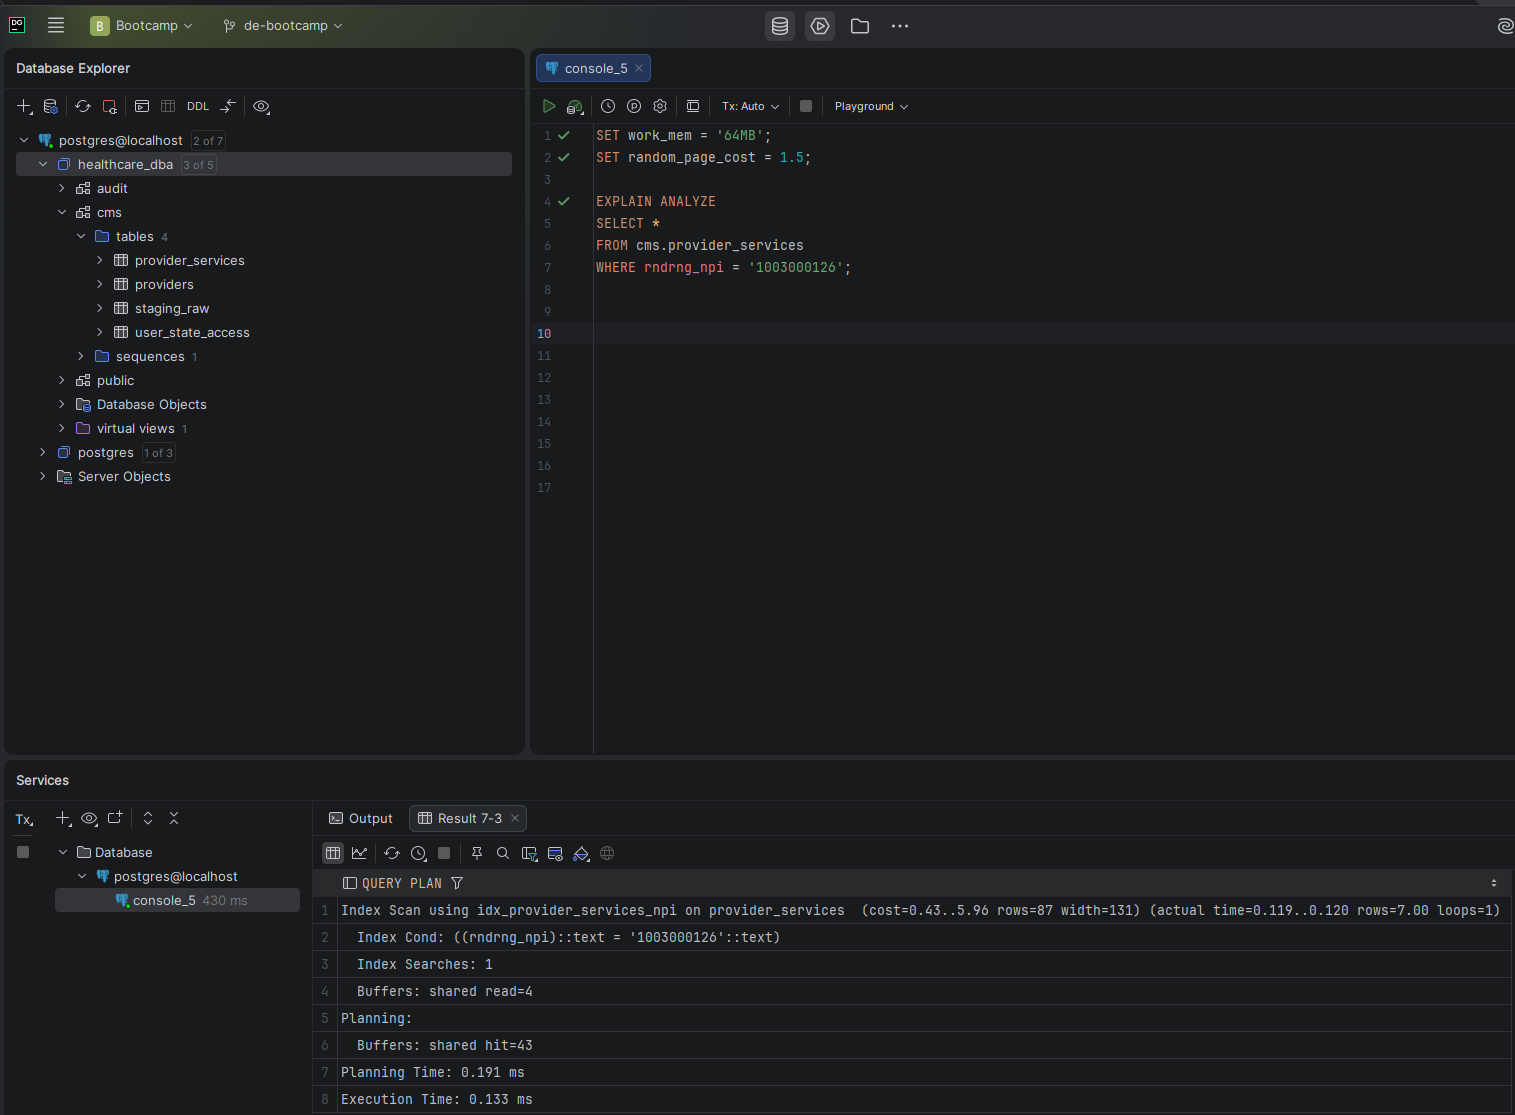
idx_provider_services_npi
provider_services · rndrng_npi · 100 MB · ~16s build
The most critical index. Phase 2 showed Q2 scanning 3.2M rows to return 7 records because no index existed on this join column. This single index produced the 4,136× improvement.
idx_provider_services_hcpcs
provider_services · hcpcs_cd · 64 MB · 16s build
Supports procedure-level aggregations. Q5 was sorting all 9.6M rows by HCPCS code with no index support — this index enables the planner to use more efficient access paths.
idx_providers_state
providers · state_abbr · 8 MB · 1s build
Supports geographic filtering on the providers table. Low-cost index on a 1.17M row table that enables efficient state-level filtering and sorting.
idx_providers_type
providers · provider_type · 8.2 MB · 1.4s build
Supports specialty filtering and group-by operations on provider type. Complements the composite index for queries filtering on type alone.
idx_providers_state_type
providers · state_abbr, provider_type · 8.5 MB · 2.3s build
Composite index supporting Q4 which groups by both state and provider type together. More efficient than two separate indexes for this specific query pattern.

Memory & Planner Settings

Addressing the Disk Spill Problem

Phase 2 showed sort and hash operations spilling up to 307 MB per worker to disk — entirely because of the 4MB default work_mem. I tested with 256MB at the session level, which confirmed the spill was memory-related. However, I discovered that setting work_mem too high globally suppresses parallel query execution — the planner becomes conservative about total memory usage across all workers.

After testing I settled on 64MB as the permanent global setting. This eliminates most disk spill while preserving parallel execution for the heaviest workloads.

work_mem
4 MB
64 MB
random_page_cost
4.0
1.5

random_page_cost was reduced from 4.0 (tuned for spinning disk) to 1.5 to reflect the SSD storage on this system. This tells the query planner that random page access is relatively cheap, encouraging it to favor index scans over sequential scans where appropriate.

Screenshot — Configuration settings after tuning
PostgreSQL configuration settings showing work_mem at 64MB and random_page_cost at 1.5
work_mem confirmed at 64MB, random_page_cost at 1.5 — both settings permanently applied in postgresql.conf

Before & After

The Headline Result

I re-ran all five baseline queries after applying the indexes and configuration changes. Every execution time is measured from EXPLAIN ANALYZE — actual runtime, not estimates.

Screenshot — Q2 optimized execution plan
EXPLAIN ANALYZE output showing Q2 now uses an index scan in 0.11ms instead of a 455ms sequential scan
Q2 after optimization — index scan reading 4 buffer pages in 0.11ms, down from a 455ms parallel sequential scan through 3.2M rows
Query Description Before After Result
Q1 Provider lookup by NPI 1 ms 0.053 ms 19× faster
Q2 Services for a specific provider 455 ms 0.110 ms 4,136× faster
Q3 Top 10 providers by payments 10,701 ms 8,795 ms 18% faster
Q4 Services by state & provider type 25,190 ms 25,082 ms Marginal
Q5 High value procedures 9,821 ms 5,527 ms 44% faster
Honest Finding — Q4

Not every query can be dramatically improved — and documenting that is as important as the big wins. Q4 processes all 9.6 million service rows, joins to all 1.17 million providers, and sorts the entire result set. There is no selective filter to exploit. I also discovered that setting work_mem too high (256MB) actually made Q4 slower by suppressing parallel execution. The final 64MB setting restores parallel workers while reducing disk spill. Some queries have an optimization floor, and a DBA needs to know when that floor has been reached.