Before touching a single configuration setting or adding a single index, I measured everything. Table sizes, index inventory, cache hit ratios, sequential scan patterns, and execution plans for five representative queries. These numbers are the baseline that every Phase 3 improvement gets measured against.
The first thing I did was establish storage baselines — total database size, individual table sizes, and the index inventory. This tells me what I'm working with before any optimization decisions are made.
| Table | Total Size | Table Size | Index Size |
|---|---|---|---|
| staging_raw | 3,305 MB | 3,304 MB | 0 bytes |
| provider_services | 1,772 MB | 1,564 MB | 207 MB |
| providers | 298 MB | 263 MB | 35 MB |
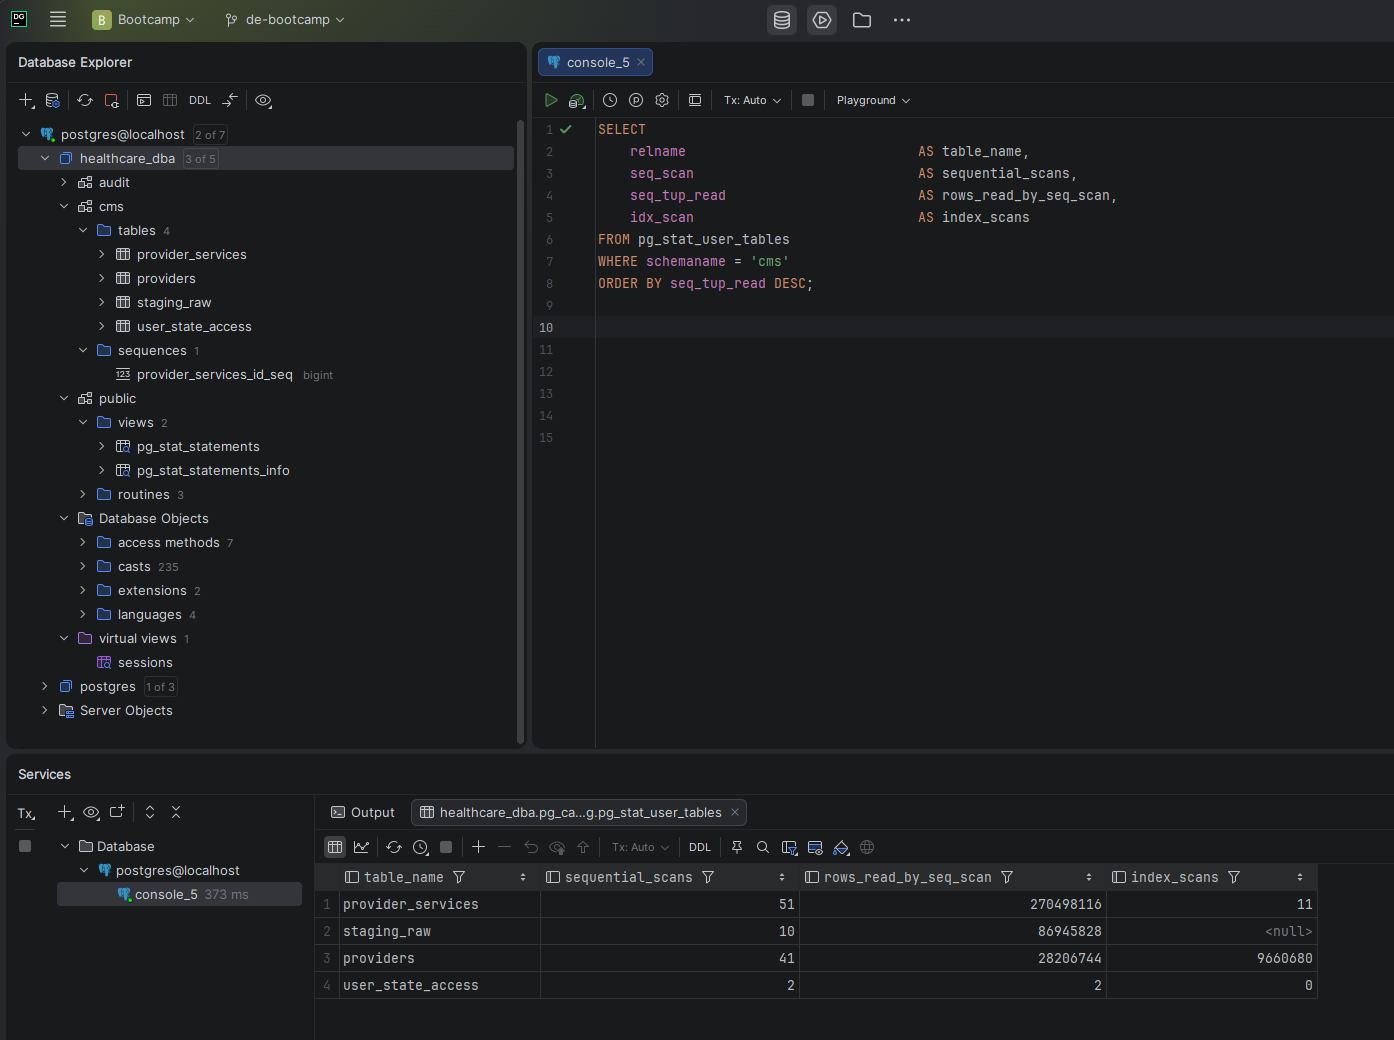
The key observation here: both production tables have only their primary key indexes. No analytical indexes exist on any filter, join, or group-by columns. Every analytical query is going to do a full sequential scan.
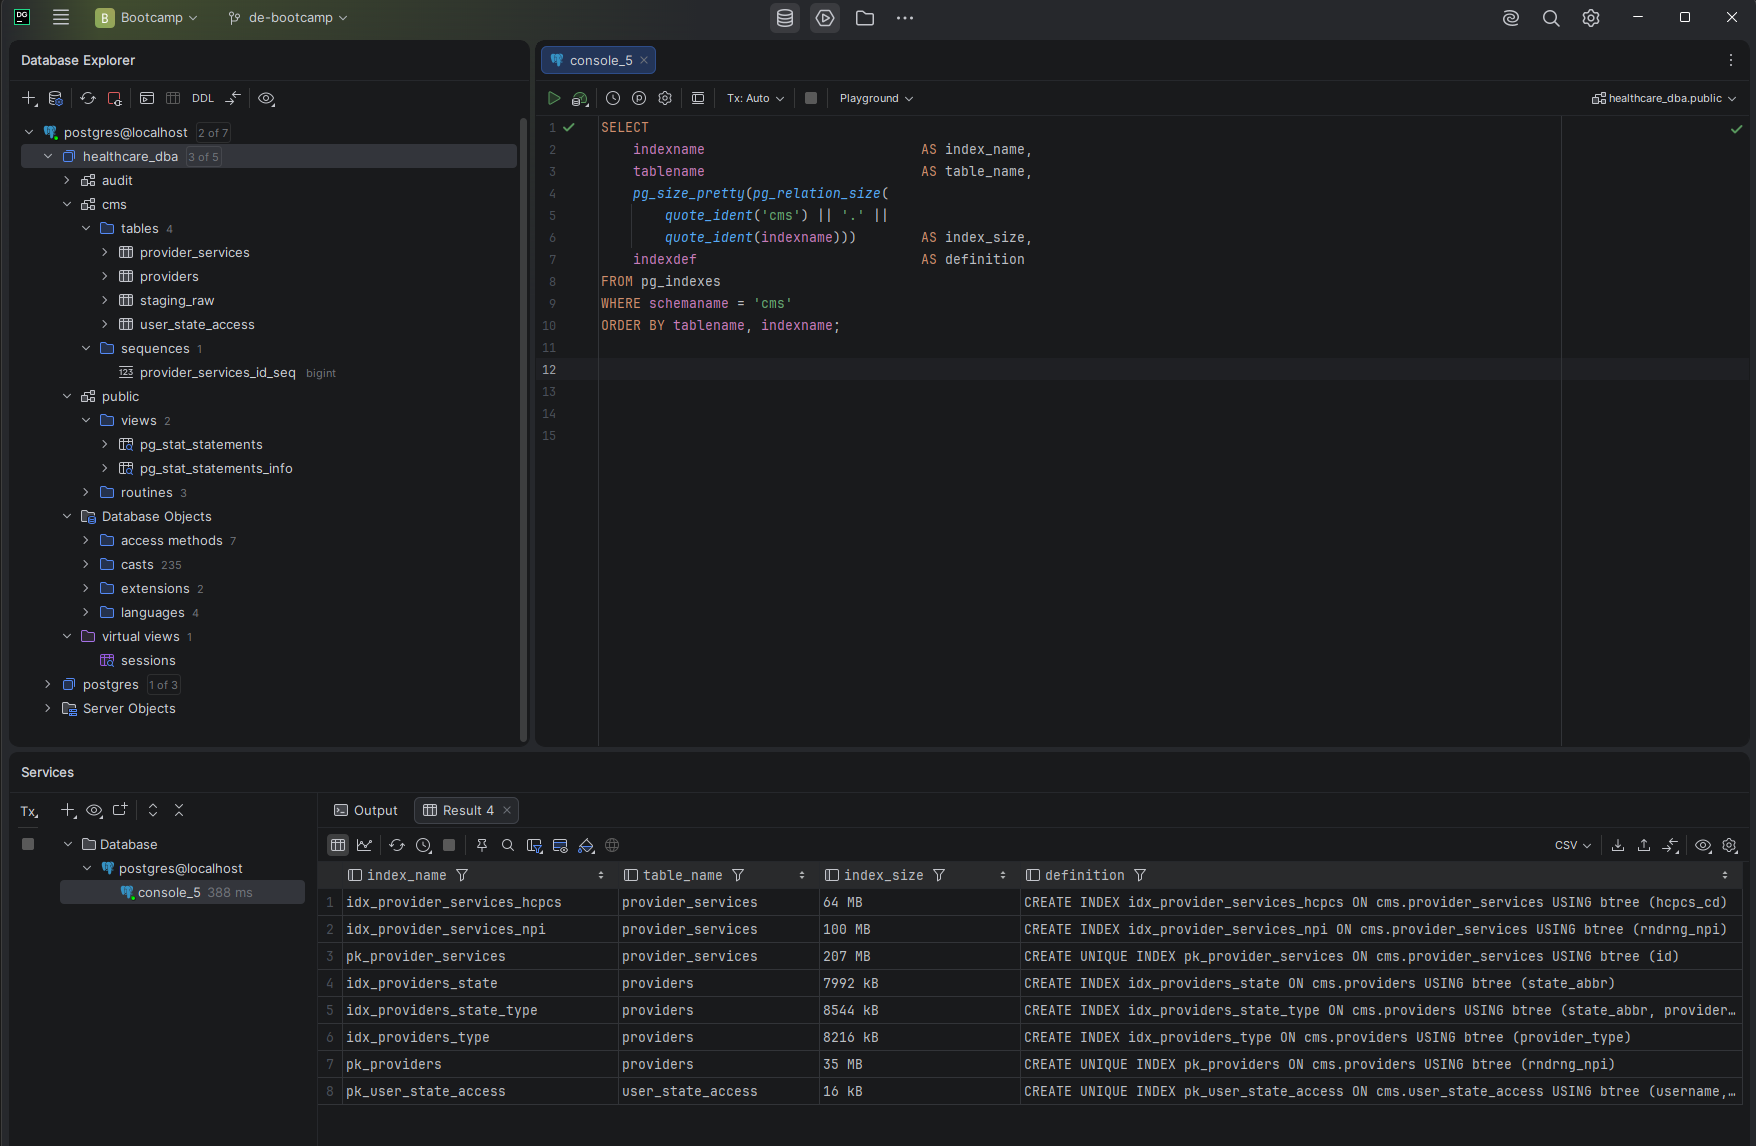
I queried pg_stat_user_tables to see how many sequential scans each table had accumulated and how many rows those scans read. The results confirmed the missing index problem.
I ran five representative analytical queries using EXPLAIN ANALYZE to capture actual execution plans and timings. I also enabled pg_stat_statements to track cumulative query statistics across sessions.
The baseline measurements tell a clear story. Two root causes are responsible for all the performance problems I measured. Both are addressable — and both will be fixed in Phase 3.
rndrng_npi in provider_services, on state_abbr, on provider_type, or on hcpcs_cd. Every analytical query is doing a full sequential scan regardless of how selective the filter is.These two findings directly inform the optimization strategy in Phase 3 — targeted indexes first, then memory configuration tuning.